Posts
Ukraine
Posts
I struggled recently getting AWS Gateway to implement query string caching. Here is the order of the steps you need to take: In the API Gateway console, under Resources, navigate to your API method and method. In Method Request, add a new URL Query String parameter checking Required and Caching. Deploy the API (because you always forget!) Under Stages, on the Settings tab, click the Enable API cache API.
Configuration Order To Get Query String Caching to Work in AWS API Gateway
I struggled recently getting AWS Gateway to implement query string caching. Here is the order of the steps you need to take: In the API Gateway console, under Resources, navigate to your API method and method. In Method Request, add a new URL Query String parameter checking Required and Caching. Deploy the API (because you always forget!) Under Stages, on the Settings tab, click the Enable API cache API.
Posts
Git Log Analysis
Posts
Every time I look at the Lambda monitoring tab in the AWS Console, one of the charts drives my crazy. AWS has good intentions behind the charts. These charts show the performance of a Lambda, a tiny split-second function. AWS does a decent job of providing monitoring charts to show you the golden signals of your service performance: Traffic is displayed in the Invocations chart showing how many times the lambda was called Latency is displayed in the Duration chart showing how long the lambda took to execute Errors are displayed the Error count and success rate chart.
I hate one of these AWS charts with the passion of a thousand burning suns! ☀️
Every time I look at the Lambda monitoring tab in the AWS Console, one of the charts drives my crazy. AWS has good intentions behind the charts. These charts show the performance of a Lambda, a tiny split-second function. AWS does a decent job of providing monitoring charts to show you the golden signals of your service performance: Traffic is displayed in the Invocations chart showing how many times the lambda was called Latency is displayed in the Duration chart showing how long the lambda took to execute Errors are displayed the Error count and success rate chart.
Posts
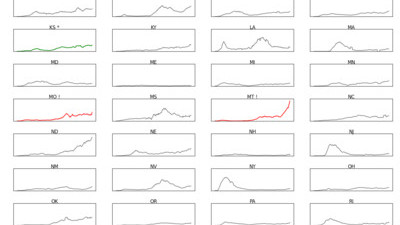
As I hear news stories about COVID-19 trends, I like to look at data to form my own opinion if the narratives are in line with the data. I often want to compare current numbers to the high-water marks for bellweather countries and states. For international COVID data visualizations, my favorite site is Financial Times’ Coronavirus Chart. I like to see the metrics per 1M people so I can compare countries, regardless of their size.
Using Tiny Charts To Form My Opinion
As I hear news stories about COVID-19 trends, I like to look at data to form my own opinion if the narratives are in line with the data. I often want to compare current numbers to the high-water marks for bellweather countries and states. For international COVID data visualizations, my favorite site is Financial Times’ Coronavirus Chart. I like to see the metrics per 1M people so I can compare countries, regardless of their size.
Posts
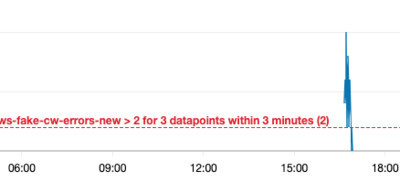
I was recently struggling with getting a CloudWatch alarm on a log filter metric to work. I was refactoring the creation from a CloudFormation template into just Lambda Python code. I was able to get both the filter metric (looking for errors and exceptions in logs) and alarm created. But, when I tested the alarm, it never went into an alarm state, even when then metric filter showed active data. It was driving me crazy.
CloudWatch Metric Filter Works, But Alarm Doesn't
I was recently struggling with getting a CloudWatch alarm on a log filter metric to work. I was refactoring the creation from a CloudFormation template into just Lambda Python code. I was able to get both the filter metric (looking for errors and exceptions in logs) and alarm created. But, when I tested the alarm, it never went into an alarm state, even when then metric filter showed active data. It was driving me crazy.
Posts
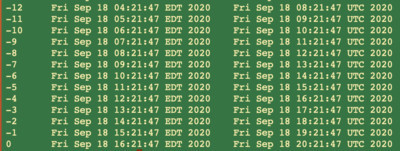
I always struggle trying to convert GMT time to EST or EDT especially in 24 hour format. It’s even harder when I’m staring at a log file trying to find the root cause of an issue. I wrote this bash alias to output the last 24 hours of time in both local and GMT. I find I’m using it all of the time now. Since it’s an alias, I can easily run it from a Terminal window or within VSCode.
Bash alias for GMT
I always struggle trying to convert GMT time to EST or EDT especially in 24 hour format. It’s even harder when I’m staring at a log file trying to find the root cause of an issue. I wrote this bash alias to output the last 24 hours of time in both local and GMT. I find I’m using it all of the time now. Since it’s an alias, I can easily run it from a Terminal window or within VSCode.
Posts
Here is a Cloudformation template snippet to create a CloudTrail that is used to also record data events for Lambda invocations and S3 operations in addition to the typical management events from CloudTrail. CloudTrail: Type: AWS::CloudTrail::Trail DependsOn: - SNSTopicPolicy - S3BucketPolicy Properties: S3BucketName: Ref: S3Bucket SnsTopicName: Fn::GetAtt: - SNSTopic - TopicName IsLogging: true EnableLogFileValidation: true IncludeGlobalServiceEvents: true IsMultiRegionTrail: true EventSelectors: - DataResources: - Type: AWS::Lambda::Function Values: - arn:aws:lambda - DataResources: - Type: AWS::S3::Object Values: - "arn:aws:s3:::"
AWS Cloudformation Template for CloudTrail
Here is a Cloudformation template snippet to create a CloudTrail that is used to also record data events for Lambda invocations and S3 operations in addition to the typical management events from CloudTrail. CloudTrail: Type: AWS::CloudTrail::Trail DependsOn: - SNSTopicPolicy - S3BucketPolicy Properties: S3BucketName: Ref: S3Bucket SnsTopicName: Fn::GetAtt: - SNSTopic - TopicName IsLogging: true EnableLogFileValidation: true IncludeGlobalServiceEvents: true IsMultiRegionTrail: true EventSelectors: - DataResources: - Type: AWS::Lambda::Function Values: - arn:aws:lambda - DataResources: - Type: AWS::S3::Object Values: - "arn:aws:s3:::"
