Temperature Chart To Help Kids Pick Their Clothes
As we’ve entered spring, my kids have been begging to wear shorts and short-sleeved shirts (their favorite set of clothes). In Virginia, we can still have wide temperature swings from day to day. So, each day they ask if they can wear shorts and I check the temperature. I’ve been having them read the two-digit temperature value and they’ve gotten good at that. But, I wanted a way for them to figure out the type of clothes to wear. So, I tried creating a graphic to help them learn if a temperature value was hot or cold. I first thought of a gradient graphic showing values going from hot to cold. I used Excel to create a graphic like this:

But, I didn’t like the skinny, vertical layout. And, after doing some user testing with my kids, it still didn’t answer their question if they can wear shorts.
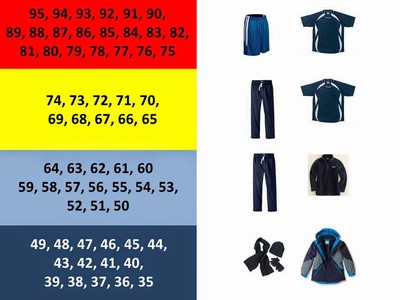
So, I went with a more horizontal block style and included pictures of shorts, various, shirts, and jackets. I used PowerPoint to create this graphic:

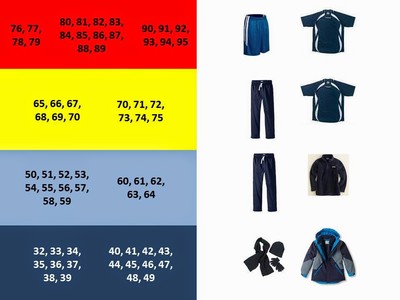
It worked pretty well for helping them determine the types clothes they can wear. But, I noticed they struggled finding the actual number. I think it’s because the numbers are in descending order and lumped together. So, I’m going to try this new version to see if it helps:

Here is the PowerPoint file if you want to customize it.